
Group Journey Reports by Day, Week, or Month
Group your data within a selected date range in the Journey Summary Report.
Overview
You can now break down your journey summary report into smaller time periods. Instead of getting one row for your entire selected duration, you can group the data by day, week, or month. This gives you a clearer view of how your journey performed over time.
This applies to the journey summary report only. You can use it for both one-time downloads and scheduled downloads.
Why use this
Before this update, a journey summary report showed one row for the whole date range you picked. So if you pulled a 30-day report, you got 30 days of performance squeezed into a single row. There was no way to see day-by-day or week-by-week movement.
Now you can choose how you want the data grouped. This helps you spot trends, compare specific weeks, or track daily performance without running multiple reports.
Group Your Journey Report
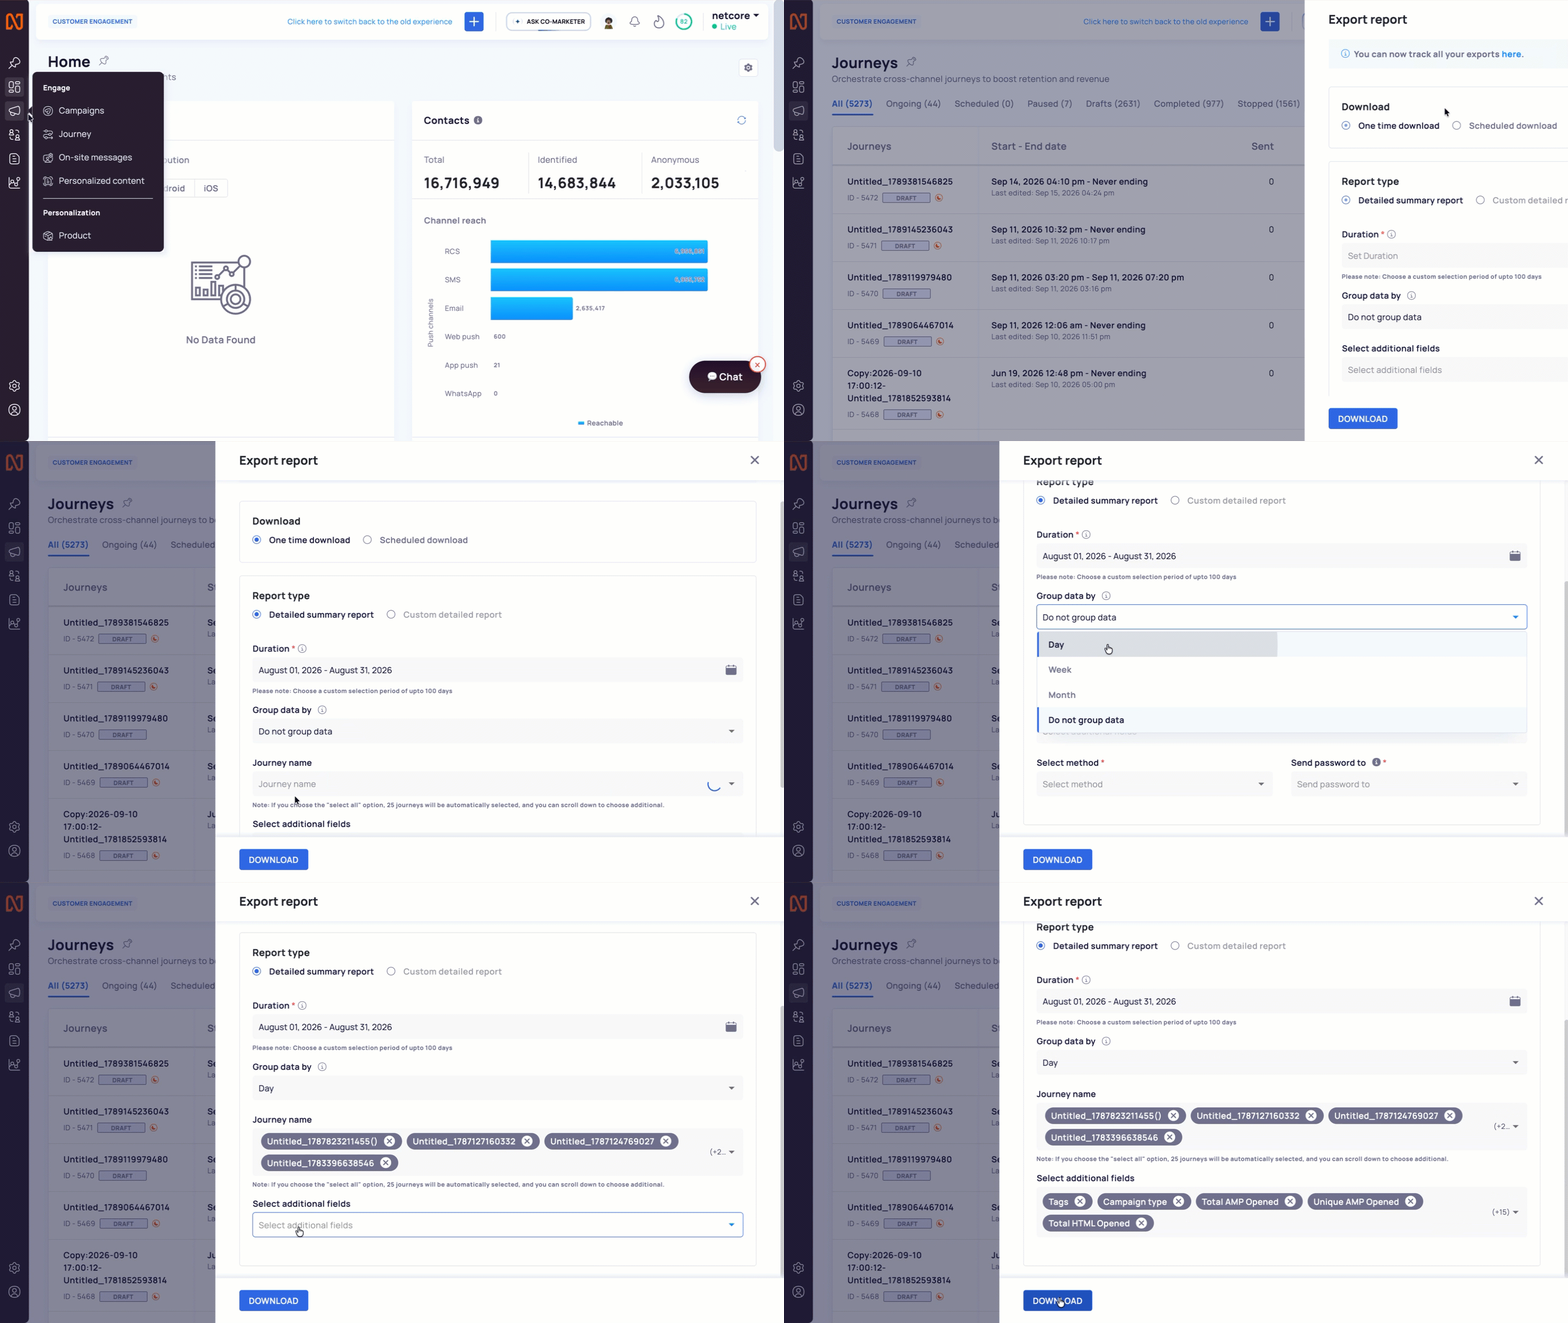
Group Journey Reports by Day, Week, or Month
Follow the steps below to group your journey report.
- Log in to the Netcore CE dashboard and go to Engage > Journey. You will see a list of all your journeys.
- Click the download icon. The Export report panel opens on the right.
- Under Download, pick One time download or Scheduled download.
- Under Report type, select Detailed summary report. Grouping is available only for this report type. It is not available for the custom detailed report.
- Click the Duration field and pick your date range. You can select a preset like Last 15 Days or Last Month, or choose a custom range. You can select up to 100 days in one report.
- Select a grouping option. Click the Group data by dropdown. Choose one of the following:
| Option | What it does |
|---|---|
| Day | Adds one row for each day in your selected duration |
| Week | Adds one row for each week, Monday to Sunday |
| Month | Adds one row for each calendar month |
| Do not group data | Keeps the old behavior, one row for the whole duration |
Hover over the info icon next to Group data by if you want a quick reminder of what this field does.
- Pick your journeys
In the Journey name field, search and select the journeys you want in this report. You can select journeys one by one, or choose Select all to include the first 25 automatically. You can scroll down to add more after that.
- Add extra fields if you need them
Use Select additional fields to add extra columns to your report, such as Tags, Campaign type, Template Name, or UTM parameters. Click Select all if you want every available field in your export.
- Once your fields look correct, click Download.
If you chose Scheduled download, you will also need to set a method and where to send the password, so your file reaches you on the schedule you want.
Refer to this sheet to view sample reports.
How the grouped data looks in your CSV
When you group your data, your CSV gets extra rows instead of just one summary row. A new column called Grouped by duration is added right after the Automation/Journey End Date column. This column tells you which period each row belongs to.
Here is how the values in that column look for each grouping option:
| Group by | Example column value |
|---|---|
| Day | Dec 10, 2025 |
| Week | Dec 10, 2025 to Dec 16, 2025 |
| Month | Dec 2024 |
Example: grouping by week
Say you pull a report for November 1 to November 30, 2024 and group it by week. Your CSV would show one row per week, like this:
| Grouped by duration | Delivered | Open Rate | Click Rate | Conversion Rate |
|---|---|---|---|---|
| Nov 01 - Nov 07, 2024 | 10,000 | 25% | 5% | 2% |
| Nov 08 - Nov 14, 2024 | 12,000 | 27% | 6% | 2.5% |
| Nov 15 - Nov 21, 2024 | 15,000 | 28% | 7% | 3% |
| Nov 22 - Nov 30, 2024 | 20,000 | 30% | 8% | 3.5% |
Grouping by day or month works the same way. Day gives you one row per date. Month gives you one row per calendar month.
Things to keep in mind
- Grouping is available only for the detailed summary report, not the custom detailed report.
- Month grouping needs a long enough date range. If your selected duration is too short, you will see a message saying month aggregation is not available for that range.
- Your selected duration can span up to 100 days.
- If you want to learn more about reports in general before you download, use the Learn more about reports link on the export panel. It takes you to the reports section of the Netcore docs.
Download Report: Quick Reference
| Step | Action |
|---|---|
| 1 | Go to Engage > Journey |
| 2 | Click the download icon to open Export report |
| 3 | Choose Detailed summary report |
| 4 | Set your duration |
| 5 | Pick a Group data by option: Day, Week, or Month |
| 6 | Select your journeys |
| 7 | Add any extra fields you need |
| 8 | Click Download |
Updated about 4 hours ago